Strategies for CSS layout debugging
Sometimes, CSS layouts are hard to debug. Here are some ideas to make it effective.
CSS is… “different”. I breathe CSS, I find it an incredible language and I really enjoy working with it. But I know that because of its declarative nature and cascade logic it’s a technology that can make our lives difficult if not worked on properly.
And this is even more difficult if the structure of the HTML markup is made more complex (often due to a lack of knowledge of the capabilities of CSS itself) in order to achieve the desired effect. There we’ll have guaranteed headaches.
Although working with CSS can generate different types of bugs, usually the most common are those that affect the structure of the content rendered, ie. the layout.
This is my normal debugging process:
1. Analyze the markup rendered
My first strategy to analyze and find the problem is analyze the markup rendered. You know: right click on the element that we think has the problem, choose Inspect element and then we go to check DevTools to see what is happening in reality.
It still amazes me to see that many developers who do frontend (many times they are backend devs) skip this step, and they stay looking at the source code. The point is that the problem is one of rendering, and it’s necessary to see what is affecting what is really rendered after being “painted” in the browser.
There the first thing is to look at the markup on the left, in the tab Inspector or Elements (depending on the browser) to see if we made a mistake in the markup that has been reflected in the DOM. Let’s say that is almost the same as looking at the source code but not: here the browser has already interpreted our markup and has rendered it.
It may have happened that the browser has interpreted our markup correctly and we see that in reality (something very common) we closed a tag more times than necessary, or that the same browser closed it for us (because it was missing).
A wrong markup can then cause a disaster in what is rendered, thanks to CSS.
2. Check the style rendered
If I don’t see that the problem is in the markup, I turn to look at the Style tabs, which are usually on the right.


Devtools Tabs in Firefox, Chromium and Edge
There we can see both the cascade applied to the elements in each property (where we can filter it to focus on them), and the respective areas for Computed (the values of the properties finally applied to each element), Layout, Accessibility, and many more. It really depends on the browser, each one has different features.
3. Debugging CSS visually
If I can’t find the problem in the Devtools, I go back to the rendered content. But instead of trying to find out what’s going on with scrolling, I use a small but fundamental tool that the community has been developing and sharing over the years: css-layout-hack.js
This is a small script that is saved in the bookmarks / favorites bar and allows you to activate and deactivate it with just one click.
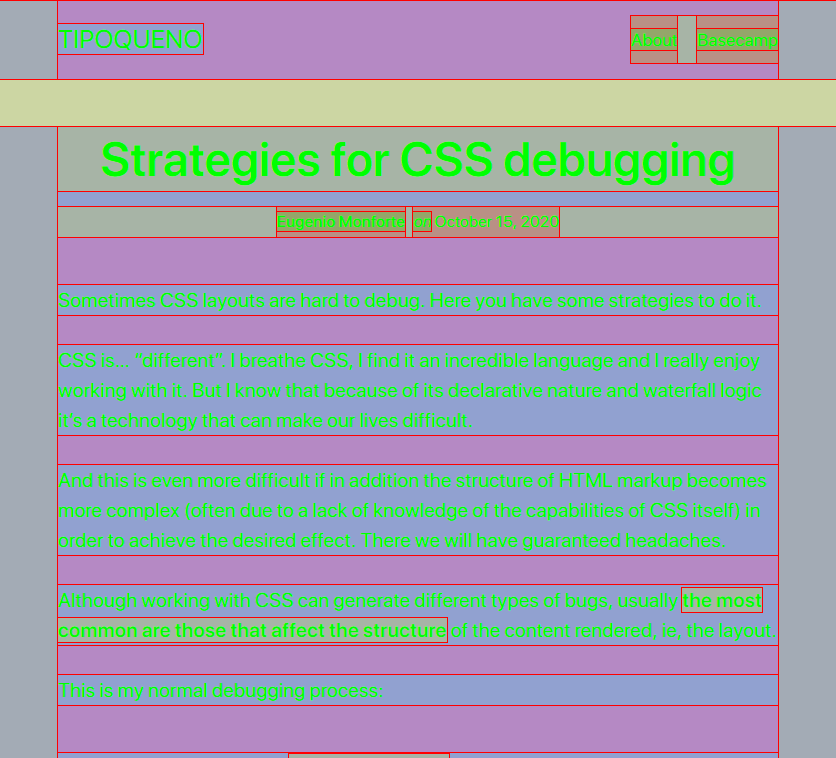
This script changes the background colors of the elements and adds a red border to everything, which allows us to easily visualize structure problems.

There is another similar tool but only for Chrome-based browsers (as its name indicates): Chrome Debugger
Conclusion
CSS is “special”. But tackling it effectively is just a matter of doing it with the right mindset and tools.
Do you think this article can help anyone? Share it!
Thank you very much.